What Happens Before a Food Goes Viral?
The useful research window is not the peak. It is the period when a small signal starts becoming independent demand.


The useful research window is not the peak. It is the period when a small signal begins producing independent repetition, active search and offline proof. Before a breakout is obvious, the strongest clues are often acceleration, source diversity, new intent questions and the first signs that customers—not the original promoter—are creating the next wave.
Key takeaways
- Look for accelerationA small base that doubles repeatedly can be more interesting than a large flat base.
- Look for source diversityNew networks are more informative than more posts from one circle.
- Look for push-to-pullPeople begin searching instead of only being shown the food.
- Look for hard behaviourDirections, visits, reviews, queues and sell-outs are difficult to fake at scale.
A working pre-breakout sequence
No public dataset proves that every Malaysian food breakout follows one sequence. But the research supports a useful operating model for what to watch.
- 1Unusual exposure
A creator, customer, media event, foreign trend or offline cue produces an abnormal first signal.
- 2Independent repetition
Other sources begin mentioning the food without being part of the same obvious push.
- 3Network escape
The same proposition appears in different social contexts, languages, audience types or locations.
- 4Pull
People actively search price, location, halal status, opening hours, queue time or reviews.
- 5Offline confirmation
Reviews, directions, queues, sell-outs or customer posts begin moving.
- 6Feedback
Those offline behaviours become the next content, reinforcing the cycle.
The model is deliberately sequential because late-stage metrics such as queues are not good early-warning indicators if they only appear after the opportunity is obvious.
Why network escape deserves more weight
Ugander and colleagues found that structural diversity—exposure from different social components—was strongly associated with adoption on Facebook.1 In F&B terms, the next five creators from the same launch circle may be less interesting than the first post from a completely different audience context.
| Weak early pattern | Stronger early pattern |
|---|---|
| Five creators at the same launch | Creator + ordinary customer + community page |
| All posts in one language/network | Same proposition appearing in another language/context |
| Same neighbourhood only | First independent mentions from another district/city |
| Content repeats the brand brief | People introduce new questions, comparisons or interpretations |
Why search is a critical transition
A large diffusion experiment found that active information seeking can create different and more concentrated diffusion dynamics from ordinary friend-to-friend spread.2 That makes search especially useful as a boundary between passive exposure and active consideration.
Food-specific search is also diagnostically rich. “Gepuklah” tells you awareness. “Gepuklah price,” “Gepuklah halal,” “Gepuklah queue,” “Gepuklah location” and “Gepuklah review” reveal different participation gates.
| Query type | Likely question underneath |
|---|---|
| Brand/product name | What is this? |
| Price / menu | Can I afford it / what should I order? |
| Halal / ingredients | Can I participate safely/confidently? |
| Location / parking | How difficult is the visit? |
| Queue / opening hours | Will the effort be worth it? |
| Review / worth it | Is the hype credible? |
What to monitor in the first 72 hours
A lightweight early signal sheet
- Post count by day and by source type, not only total views.
- Whether new sources are clearly independent of the first source.
- Comment intent: “where?”, “how much?”, “halal?”, “open when?”, “worth it?”.
- Branded search and Maps activity versus the previous baseline.
- Review velocity and customer-generated posts.
- Queue/sell-out observations with context: promotion, capacity, price and time.
- Geographic spread: same block, same city, another city.
- Negative friction: parking, price, halal uncertainty, wait time, stock availability.
A food does not need all eight signals. The value is in seeing whether the signal is moving from low-cost online behaviour toward increasingly costly actions.
What not to mistake for an early breakout
Structural virality research warns against equating large reach with deep diffusion.3 Malaysian restaurant research also shows that crowding and reviews can affect purchase intention, which means queues are both evidence and potential amplifiers—not pure measures of underlying demand.4
| Signal | Why it can mislead |
|---|---|
| One huge video | Could be a broadcaster event with no reproduction |
| Launch-day queue | Could be discount, giveaway, capacity or event concentration |
| Hashtag volume | May be campaign coordination rather than independent demand |
| High saves | Potential interest, not proof of visit |
| Media coverage | Can create awareness without customer conversion |
| Competitor copy | May be late supply response after demand has already peaked |
A signal ladder from easiest to hardest to fake
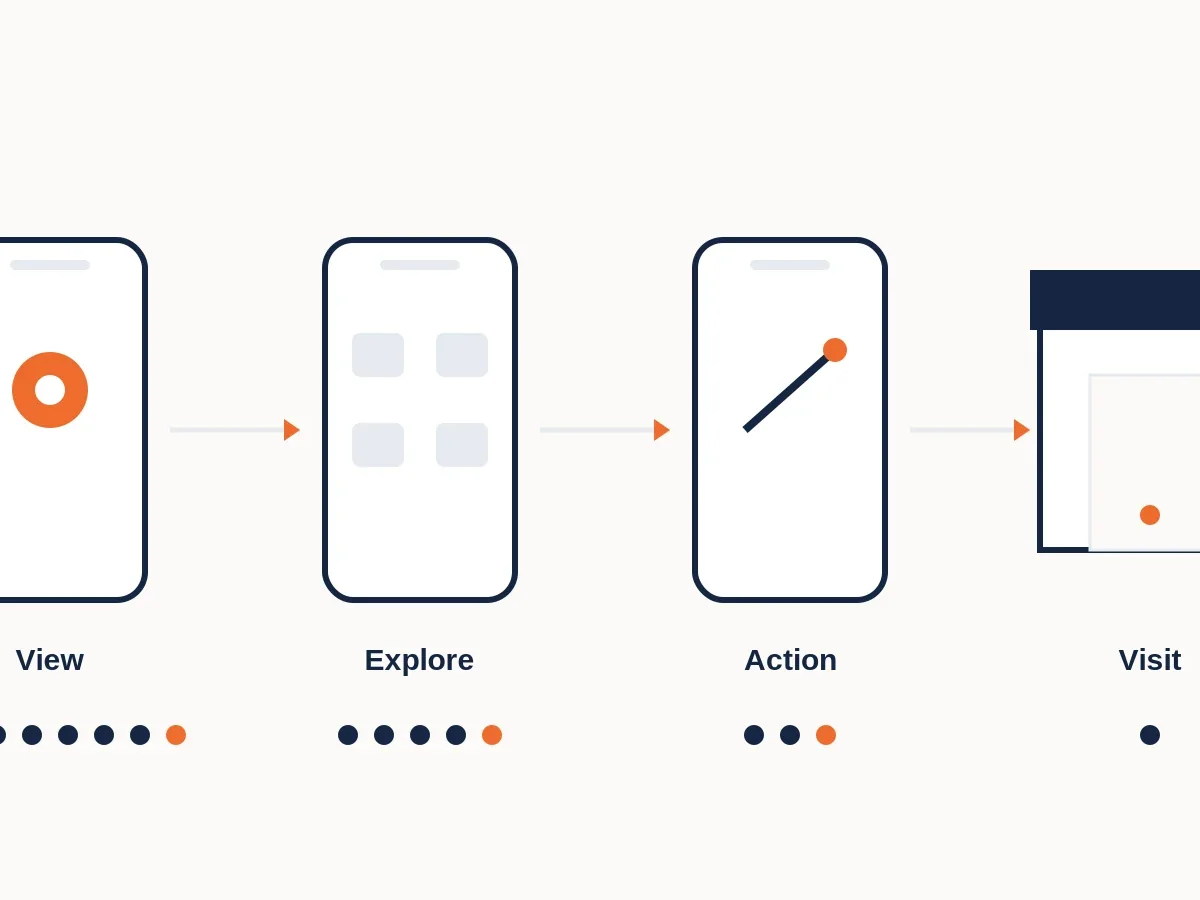
Not all early signals deserve equal weight. A useful way to prioritise them is by the amount of effort or cost required from the consumer.
| Signal | Consumer cost | Interpretation |
|---|---|---|
| View | Very low | Awareness |
| Like | Very low | Light reaction |
| Share/send | Low | Transmission intent |
| Save | Low to medium | Future relevance |
| Search | Medium | Active information seeking |
| Directions / reservation | Medium to high | Visit planning |
| Travel / queue / purchase | High | Real behavioural commitment |
| Review / independent post | High | Post-visit reproduction |
A healthy breakout tends to move upward through this ladder rather than remaining trapped at the top. This is why a modest search or review spike can be more informative than a huge increase in likes.
Every early-warning system needs a baseline
“Up 200%” is meaningless without knowing the starting point. A restaurant going from one mention per week to three has technically tripled, but that may still be noise. A restaurant going from 20 to 60 independent mentions while branded search and review velocity rise at the same time is more compelling.
For a practical restaurant monitor, compare the current 7-day and 28-day period against the restaurant’s own previous baseline and against nearby competitors. The question is not only “is activity rising?” but “is it rising unusually fast relative to what normally happens here?”
A practical seven-day watch after the first unusual signal
When something looks unusual, do not wait for a month-end report. A simple daily log is enough to detect whether the signal is maturing.
| Day / window | Question to ask |
|---|---|
| Day 0–1 | Who created the first abnormal spike? Was it paid, creator-led, customer-led or media-led? |
| Day 1–2 | Are independent sources appearing, or only reposts of the same source? |
| Day 2–3 | Are intent questions increasing? |
| Day 3–4 | Is branded search or Maps activity moving? |
| Day 4–5 | Are customers posting after visiting? |
| Day 5–7 | Has the signal escaped into another community or location? |
| End of week | Is offline behaviour still elevated without a fresh push? |
The point is not that every breakout takes seven days. Some are faster, some much slower. The discipline is to watch the transition between stages instead of waiting for “viral” to become obvious.
Research notes & sources4 sources
How this article was researched
The sequence is an ORBIT synthesis of diffusion research and restaurant decision signals. It is intended as a monitoring framework, not a validated numerical forecast model.
- Ugander et al. — Structural diversity in social contagion
PNAS, 2012. Adoption was strongly related to exposure from distinct social contexts, not simply the number of exposed contacts. - Product diffusion through on-demand information-seeking behaviour
Large field experiment seeded 70,000 vouchers into a network of about 43 million people; active information seeking produced distinctive winner-take-all diffusion. - Goel et al. — The Structural Virality of Online Diffusion
Management Science, 2015. Analyses roughly one billion Twitter diffusion events and separates large broadcast from multi-generation diffusion. - Online reviews and crowd cues in Malaysian restaurant choice
Malaysian restaurant study (N=200). Review ratings and perceived crowding positively affected purchase intention.
What this research cannot proveLimitations
Without platform impression logs, transaction data and matched failure cases, we cannot yet estimate the probability that any one early signal will lead to a Malaysian breakout. The framework is directional, not probabilistic.